Pricing Intelligence for a Regional Ferry Operator
Regional European ferry operator
We built an automated pricing intelligence pipeline that collects competitor fares daily across every route, passenger combination, and vehicle category. The operator’s pricing team went from weekly spreadsheet snapshots to near-real-time competitive visibility.
The Challenge
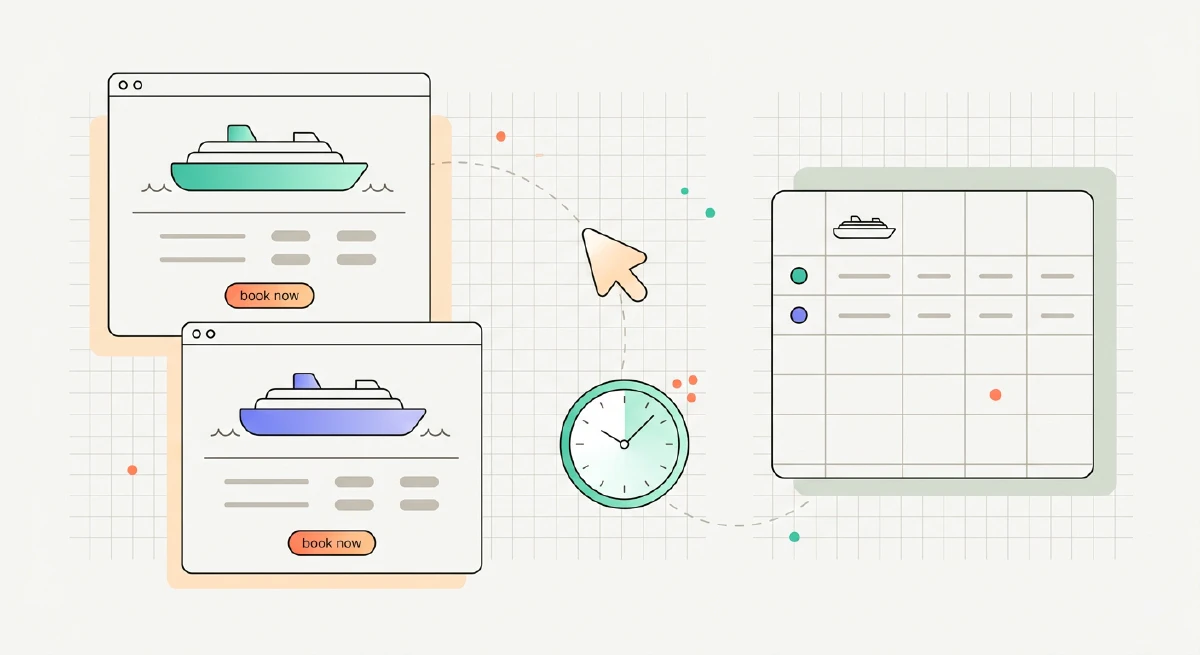
Competitor fares changed multiple times per day, but the client’s pricing team only captured a partial snapshot once a week. Decisions were based on stale data, costing the operator both speed and revenue.
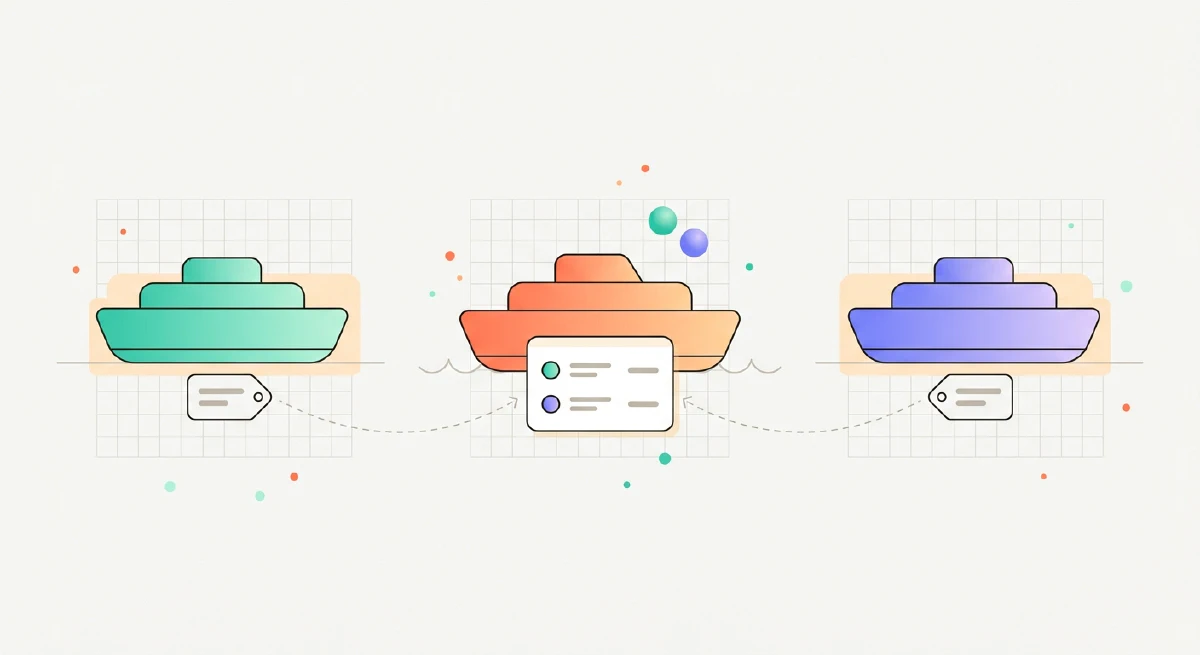
Ferry pricing is granular. Fares shift by route, date, passenger type (solo, duo, family), vehicle presence, and vehicle category. The client’s pricing team tracked competitors manually in spreadsheets, but the market moved faster than they could keep up. Weekly snapshots missed intra-day price swings entirely. The result: tariff decisions made on outdated information, and revenue left on the table.
Our Approach
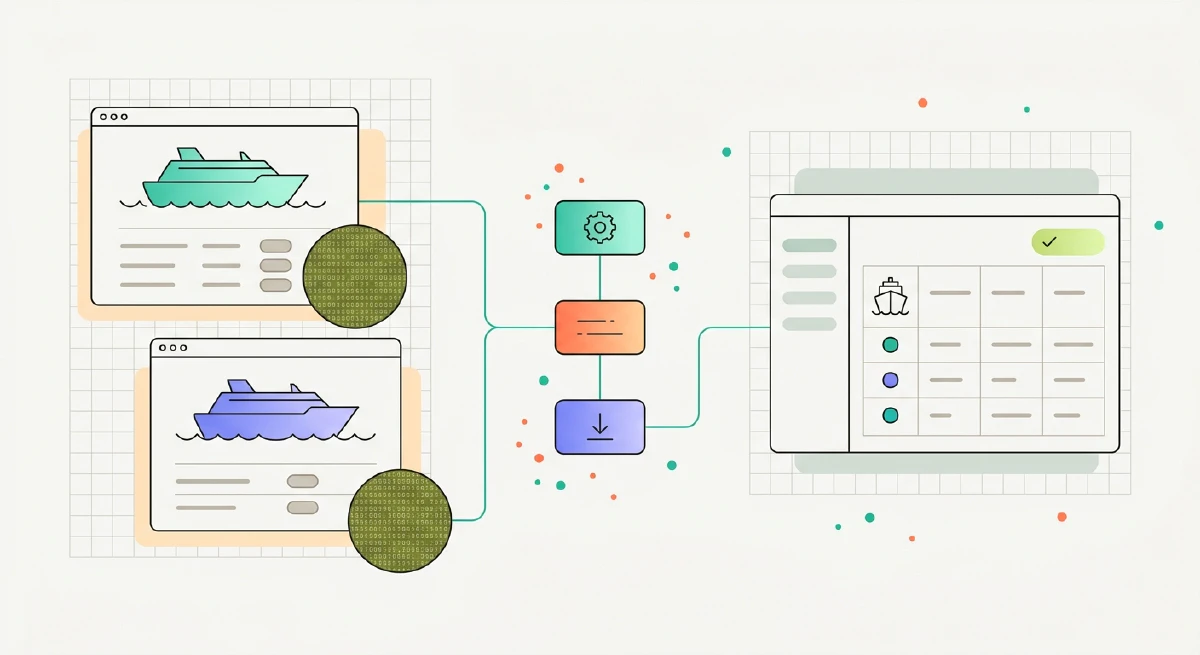
We built an automated pipeline that collects competitor fares daily for every relevant combination of route, passenger configuration, and vehicle category. Data is normalized across carriers so the pricing team can compare like-for-like without manual cleanup. The collector handles anti-bot protections through self-regenerating selectors.
What We Built
Daily fare collection
Competitor prices collected every day across all route and passenger combinations, replacing weekly manual snapshots.
Granular configuration coverage
Every passenger type (solo, duo, family), with or without vehicle, across vehicle categories. The full pricing matrix, not a sample.
Data normalization
Fares from different carriers normalized into comparable formats so the pricing team can act on them directly.
Resilient collection
Self-regenerating selectors handle anti-bot protections and site layout changes without manual intervention.
Results
The pricing team now works from fresh competitive data instead of week-old snapshots. Route-by-route fare comparisons that once consumed hours happen automatically. The system also surfaced unexpected visibility into competitor inventory levels, a strategic signal the client hadn’t anticipated.
Before & After
| Metric | Before | After |
|---|---|---|
| Manual verification time | Hours per week | 80% less |
| Pricing data latency | 24 hours | Under 20 minutes |
| Revenue on monitored routes | Baseline | +18% |
| Collection frequency | Weekly snapshots | Daily, automated |
Client Feedback
"Stratalis and their web scraping service lets us compare our trip prices against competitors and adjust our pricing strategy accordingly."